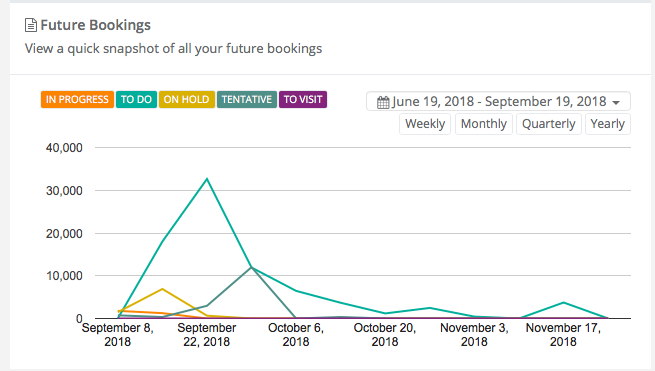
View your company’s sales summary chart
The Sales Summary Chart shows the number of sales per month over a period of time. The chart is updated automatically whenever a sale is made. This enables you to detect sales patterns over time and easily check if sales are on target. You can view the company’s sales summary chart any time. To do this:
- Go to Dashboard
- Select Future Bookings
- You will see the sales summary chart at the top of the page
- You can filter the chart by total, count, paid or all invoices by using the icons at the right of the chart
- Hover over a point in the chart to view the exact number of sales