
Past Bookings Statistics: Monitor Past Bookings, Trends, and Revenue Realized
The Past Bookings Statistics page in OctopusPro provides admin users the capability to examine, track, and scrutinize past bookings. This feature grants you a retrospective view of your business operations, providing key insights into bookings by count and sum, their status, and their frequency over your chosen periods. Situated under the Dashboard menu, the Past Bookings Statistics page is a powerful tool for understanding historical performance, refining resources allocation, and learning from the past to shape future business decisions. This guide will elucidate each feature, highlighting the multitude of benefits this tool brings to your business.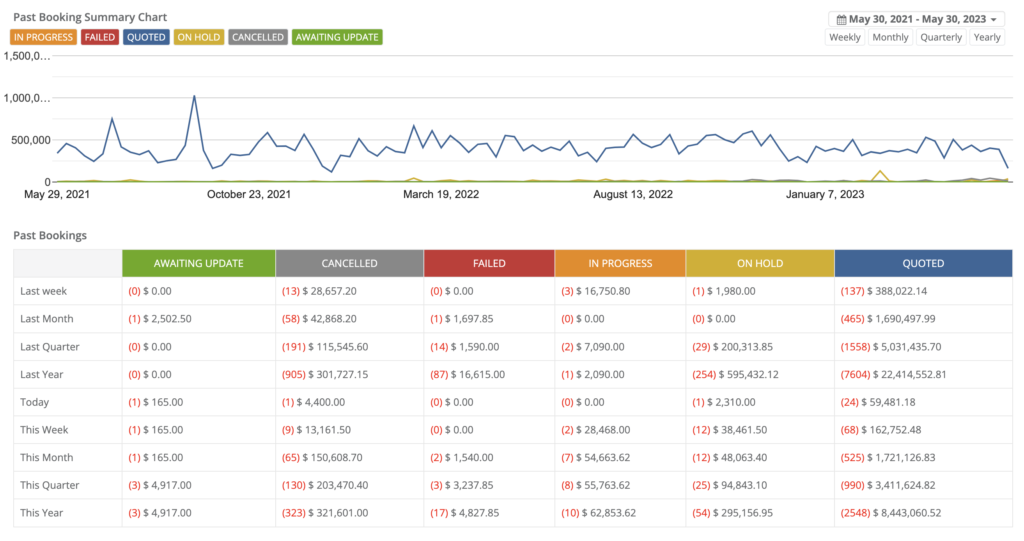
Benefiting from the Past Bookings Statistics Page:
- Historical Bookings Overview: Review your past bookings by count and sum, offering you an understanding of completed revenue and workload.
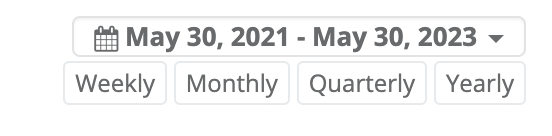
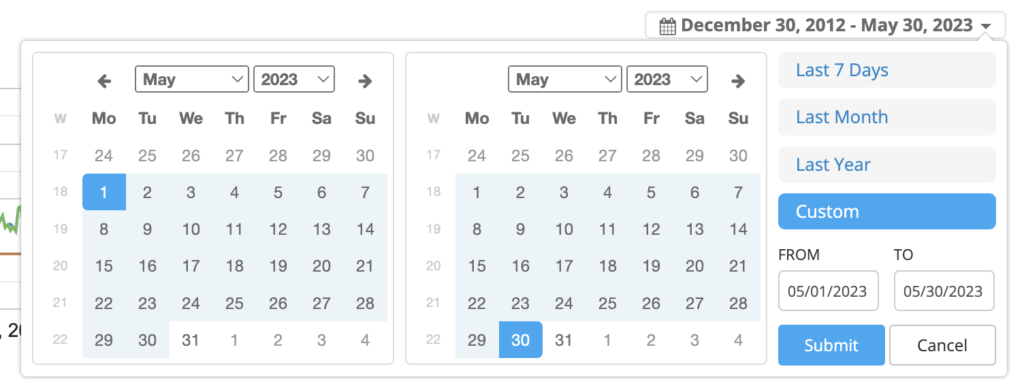
- Customizable Period Selection: Configure the display to review bookings weekly, monthly, quarterly, or yearly, offering flexibility to meet your business needs.
- Booking Status Filtering: Examine bookings classified by their status, aiding you in understanding your completed service pipeline and identifying areas of past difficulties.
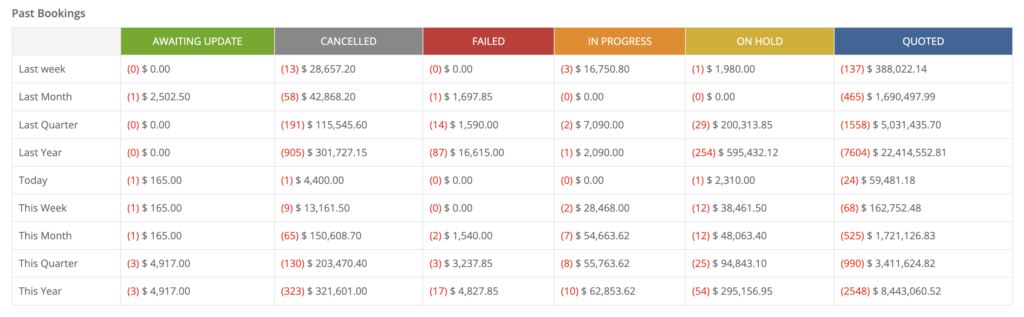
- Detailed Bookings Breakdown: An in-depth table displays past bookings by count and sum, grouped by date, and broken down by status, offering a thorough perspective of your past business.
- Trend Identification: Identify booking trends over different periods, assisting in understanding past performance and informing future strategies.
Accessing the Dashboard: Navigate from the left menu to Statistics > Past Bookings.
Interpreting Past Booking Data
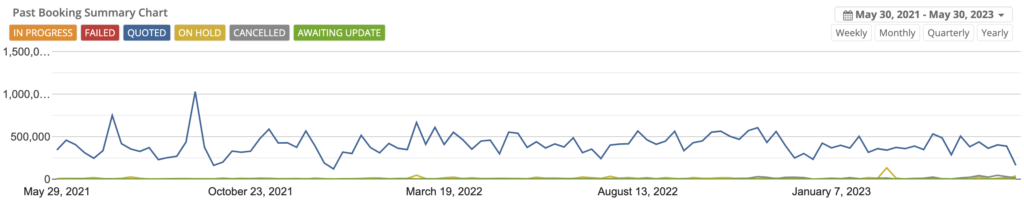
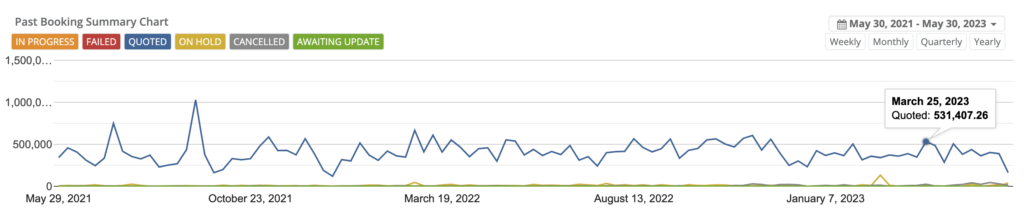
At the top of the page, you’ll find a comprehensive chart illustrating past bookings by count and sum. This chart serves as a visual aid for discerning patterns and trends over time, and can be adjusted to display weekly, monthly, quarterly, or yearly data.
The chart also allows you to filter by booking status, with each status appearing as a separate line. Hovering over a point in the chart will show the exact number of bookings for that particular status.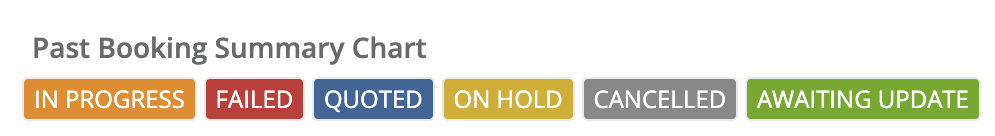
Further down, you’ll find a detailed table presenting the past bookings count and sum, grouped by date, and broken down by status. This table offers you a granular understanding of your past bookings and their impact on your business.
Viewing Your Past Bookings Statistics by Status
To see a table of all past bookings classified by their booking status and booking date, follow these steps:
- Go to Statistics > Past Bookings.
- Swipe up to see the past bookings table.
Viewing Your Company’s Past Sales Summary Chart
The Sales Summary Chart provides a visual representation of your bookings over a specific period, allowing you to identify booking patterns and verify if your past bookings were on target. To view the company’s sales summary chart, do as follows:
- Go to Statistics > Past Bookings.
- You will see the past sales summary chart at the top of the page.
- You can filter the chart by total, count, paid, or all invoices using the icons at the right of the chart.
- Hover over a point in the chart to view the exact number of bookings.
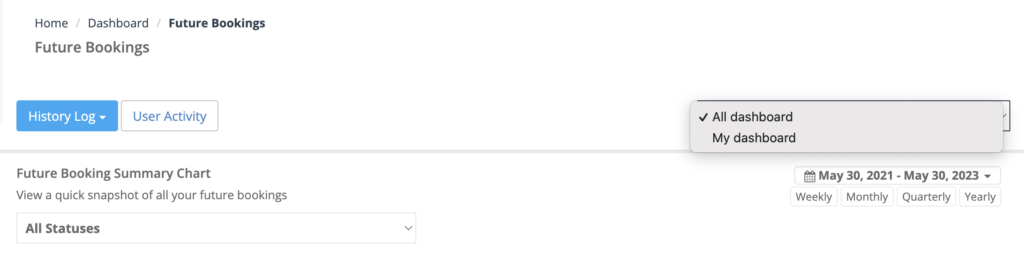
Customizing Past Bookings Statistics: My Dashboard vs All Dashboard
The Past Bookings Statistics page in OctopusPro has an advanced feature that allows users to filter data based on their role or the scope of data they wish to view. This is beneficial for understanding personal performance metrics or getting a holistic view of the company’s performance. Here are the steps on how to switch between these views:
Viewing Your Personal Past Bookings Statistics
Your personal Past Bookings Statistics chart shows the number of bookings you have made, enabling you to track your individual performance over time. This chart is automatically updated with each booking made. You can view your personal Past Bookings Statistics at any time by following these steps:
- Go to Statistics > Past Bookings.
- At the top right of the page, use the drop-down arrow to select ‘My Dashboard.’
- The Past Bookings Statistics chart will adjust to display only bookings made by you.
- You can filter the chart by total, count, paid, or all invoices by using the icons at the right of the chart.
- Hover over a point in the chart to view the exact number of bookings made.
Viewing the Company’s Past Bookings Statistics
For admin users who wish to see an overview of the company’s performance, the Past Bookings Statistics page can be adjusted to display all bookings. This is particularly useful for identifying overall trends and patterns in the company’s bookings. Here is how to view the company’s Past Bookings Statistics:
- Go to Statistics > Past Bookings.
- At the top right of the page, use the drop-down arrow to select ‘All Dashboard.’
- The Past Bookings Statistics chart will adjust to show all bookings made across the company.
- You can filter the chart by total, count, paid, or all invoices by using the icons at the right of the chart.
- Hover over a point in the chart to view the total number of bookings made.
The ability to switch between ‘My Dashboard’ and ‘All Dashboard’ gives you a tailored view of the Past Bookings Statistics, offering a more personalized or holistic approach as needed. Leverage these functionalities to deepen your understanding of and effectively respond to your or your company’s past booking trends.
To stay updated, please subscribe to our YouTube channel.